Ranked-Choice Voting in San Francisco


Since 2004, San Francisco has used an instant runoff process to elect its mayor, board of supervisors, and other officers. This way, voters rank their choices on one ballot, rather than vote for one candidate in one election and then another in a separate runoff election. Here, you can see past results and try Ranked Choice practice polls.

Rank the candidates you support, in order of preference.
Candidate1st choice2nd choice3rd choice
Lou O O X
Bob X O O
Kim O X O

Your vote will count for your highest-ranked candidate,
but some candidates may be eliminated.


right arrow
Your vote counts for Bob, your first choice. Nobody has a majority mandate from voters.
 
---------------- 50%
Kim 
KKKKKKKKKKKKKK __ :
Lou 
LLLLLLLLLL ______ :
Bob 
PPPPPPPP ________ :
So we eliminate Bob, and recount.


right arrow
Kim gets enough of Bob's second choices to get a majority.
 
---------------- 50%
Kim 
KKKKKKKKKKKKKK PP : PP
Lou 
LLLLLLLLLL PPPPP ___ :

In this count, because Bob was eliminated, your vote counted for Kim, your second choice.


Preliminary results for the competitive 2024 San Francisco RCV contests

Multi-round RCV elections Results Stats
2024 Mayor Results: Bar charts Results: Pie charts Exhausted ballot statistics
2024 Board of Supervisors, District 1 Results: Bar charts Results: Pie charts Exhausted ballot statistics
2024 Board of Supervisors, District 3 Results: Bar charts Results: Pie charts Exhausted ballot statistics
2024 Board of Supervisors, District 5 Results: Bar charts Results: Pie charts Exhausted ballot statistics
2024 Board of Supervisors, District 7 Results: Bar charts Results: Pie charts Exhausted ballot statistics
2024 Board of Supervisors, District 9 Results: Bar charts Results: Pie charts Exhausted ballot statistics
2024 Board of Supervisors, District 11 Results: Bar charts Results: Pie charts Exhausted ballot statistics

Preliminary results are also available for November 2024 East Bay RCV contests.


Past results

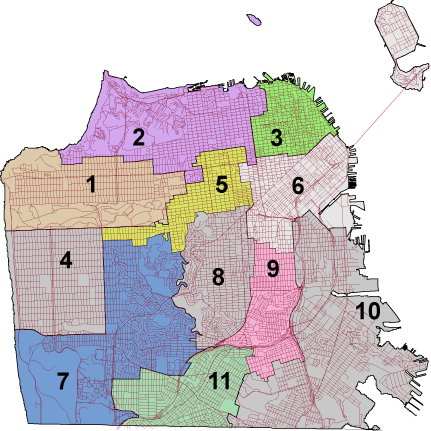
Click on a Board of Supervisors district to see its most recent multi-round election.
District map District 1 District 2 District 2 District 3 District 4 District 5 District 6 District 6 District 10 District 11 District 9 District 8 District 7 Region not in a district

This map applies to contests from 2004-2011. A new map (PDF) has slightly different boundaries.
Multi-round RCV elections Results Stats
2022 District Attorney Results: Bar charts Results: Pie charts Exhausted ballot statistics
2020 Board of Supervisors, District 1 Results: Bar charts Results: Pie charts Exhausted ballot statistics
2020 Board of Supervisors, District 7* ** Results: Bar charts Results: Pie charts Exhausted ballot statistics
2020 Board of Supervisors, District 11 Results: Bar charts Results: Pie charts Exhausted ballot statistics
2019 Board of Supervisors, District 5 Results: Bar charts Results: Pie charts Exhausted ballot statistics
2019 District Attorney Results: Bar charts Results: Pie charts Exhausted ballot statistics
2018 Board of Supervisors, District 2 Results: Bar charts Results: Pie charts Exhausted ballot statistics
2018 Board of Supervisors, District 4 Results: Bar charts Results: Pie charts Exhausted ballot statistics
2018 Board of Supervisors, District 10 Results: Bar charts Results: Pie charts Exhausted ballot statistics
2018 Mayor Results: Bar charts Results: Pie charts Exhausted ballot statistics
2016 Board of Supervisors, District 1 Results: Bar charts Results: Pie charts Exhausted ballot statistics
2016 Board of Supervisors, District 7 Results: Bar charts Results: Pie charts Exhausted ballot statistics
2016 Board of Supervisors, District 11 Results: Bar charts Results: Pie charts Exhausted ballot statistics
2014 Board of Supervisors, District 10 Results: Bar charts Results: Pie charts Exhausted ballot statistics
2012 Board of Supervisors, District 5 Results: Bar charts Results: Pie charts Exhausted ballot statistics
2012 Board of Supervisors, District 7 Results: Bar charts Results: Pie charts Exhausted ballot statistics
2011 Mayor Results: Bar charts Results: Pie charts Exhausted ballot statistics
2011 Sheriff* Results: Bar charts Results: Pie charts Exhausted ballot statistics
2011 District Attorney Results: Bar charts Results: Pie charts Exhausted ballot statistics
2010 Board of Supervisors, District 2** Results: Bar charts Results: Pie charts Exhausted ballot statistics
2010 Board of Supervisors, District 6 Results: Bar charts Results: Pie charts Exhausted ballot statistics
2010 Board of Supervisors, District 8 Results: Bar charts Results: Pie charts Exhausted ballot statistics
2010 Board of Supervisors, District 10* ** Results: Bar charts Results: Pie charts Exhausted ballot statistics
2008 Board of Supervisors, District 1 Results: Bar charts Results: Pie charts Exhausted ballot statistics
2008 Board of Supervisors, District 3 Results: Bar charts Results: Pie charts Exhausted ballot statistics
2008 Board of Supervisors, District 9 Results: Bar charts Results: Pie charts Exhausted ballot statistics
2008 Board of Supervisors, District 11 Results: Bar charts Results: Pie charts Exhausted ballot statistics
2006 Board of Supervisors, District 4 Results: Bar charts Results: Pie charts Exhausted ballot statistics
2006 Board of Supervisors, District 6 Results: Bar charts Results: Pie charts Exhausted ballot statistics
2005 Assessor-Recorder Results: Bar charts Results: Pie charts Exhausted ballot statistics
2004 Board of Supervisors, District 1 Results: Bar charts Results: Pie charts Exhausted ballot statistics
2004 Board of Supervisors, District 5 Results: Bar charts Results: Pie charts Exhausted ballot statistics
2004 Board of Supervisors, District 7 Results: Bar charts Results: Pie charts Exhausted ballot statistics
2004 Board of Supervisors, District 11 Results: Bar charts Results: Pie charts Exhausted ballot statistics

See also the East Bay results.

This page shows results of multi-round ranked-choice elections in San Francisco since 2004, as an independent and unofficial interpretation of cast vote records released by the Department of Elections. The total number of votes countable in at least the first round of the 34 multi-round elections shown here from 2004 to 2022 is 2,233,672. The results released by the Elections Department separate out all "overvotes" (more than one vote in the same column), whereas the DemoChoice software treats second- or third-choice overvotes as votes for "none of these". Ballots with no rankings or with first-choice overvotes do not appear in the DemoChoice results.

Improvements to the city's vote-counting software and released ballot data have provided greater transparency regarding how some strange cases are treated. If a ballot gives one listed candidate and an unqualified write-in the same ranking, or one eliminated candidate and one continuing candidate the same ranking, should these each be an overvote, so that ranking and lower rankings are uncountable? Currently, that is what happens.

** indicates contests where the winner overcame the leading first-round candidate in later rounds.
* indicates contests where a candidate who was not one of the top two in the first round was in the top two in the final round.